The symptom
It is Monday morning, the client's conversions are down against last week, and there is a call at two. Nobody paused a campaign, the budget is where it was, and the landing pages load fine. You have two available answers and no way to choose between them: it is the season, or something broke.
Both are expensive if you pick the wrong one. Call it seasonality and you own it if a tag has been dead for nine days. Call it a tracking problem and you have opened a technical investigation into a quiet August, plus a client who doubts the next number you send.
The dashboard cannot settle it. A drop caused by demand and a drop caused by a measurement change look identical in the one place you are looking, because a conversion chart shows what arrived, not what happened.
Why can you not tell from the dashboard?
Because three different things produce the same line, and only one of them is about the client's market.
The number may not be final yet
Recent days are systematically understated. Google Ads counts its primary conversion columns "based on the time of the click, not the time of the conversion", per Google Ads Help, so a purchase today is credited back to the click that earned it, possibly weeks ago. Conversions can arrive up to 90 days after that click depending on the conversion window, and Google states the consequence plainly: "If you compare recent performance with past performance, your recent performance might not look as strong, because some of the people who clicked your ad haven't converted yet."
GA4 has its own version. On a standard property, intraday reporting runs 2 to 6 hours behind, and Google's data freshness documentation notes that processing can take 24 to 48 hours, during which the figures in a report can still change. A dip you read before lunch is partly an artefact of when you read it.
The measurement may have changed
A release went out on Thursday. A consent banner was restyled and the accept rate moved with it. A conversion action was renamed in Google Tag Manager. Or behavioural modeling for consent mode stopped applying, because the property slipped under the thresholds Google publishes for it, among them at least 1,000 events per day with analytics storage denied for seven days. Those modeled conversions are, in Google's own words, machine learning applied to "the behavior of users who decline analytics cookies based on the behavior of similar users who accept analytics cookies". They are modeled rather than observed, so a change in eligibility moves the reported total while the market stands still.
Reporting can hide rows while you investigate. GA4 withholds data when a report includes demographic data, or audiences defined using it, and those thresholds are "system defined. You can't adjust them." Segment a drop by age and you can manufacture a smaller number than the one you started with.
Demand may really have moved
Sometimes it is the season, the one cause you cannot fix. It is also the answer people reach for first, because it requires no work and cannot be disproved in a meeting. Whether a swing of this size is normal here depends on the category, the market, the promo calendar and whatever distorted the same weeks last year, so "is this normal" is a question about the client's own history rather than about a benchmark.
Underneath all three sits the layer that is easy to forget. Roughly 15-30% of conversions are consistently never captured, for reasons unrelated to demand or to anything you changed, and the ways conversions go missing before GA4 ever sees them are mostly invisible in a report. Ad blockers alone strip 30-40% of events. The seasonal curve you are reading is a curve through the share that still arrives.
What good looks like
The order of the checks is the method: rule out the cheap explanations before the expensive ones, because the cheap ones are more common.
Establish whether the number is final. Exclude the last few days, or switch the ad platform to conversion time rather than click time, and see whether the drop survives. Many Monday panics end here.
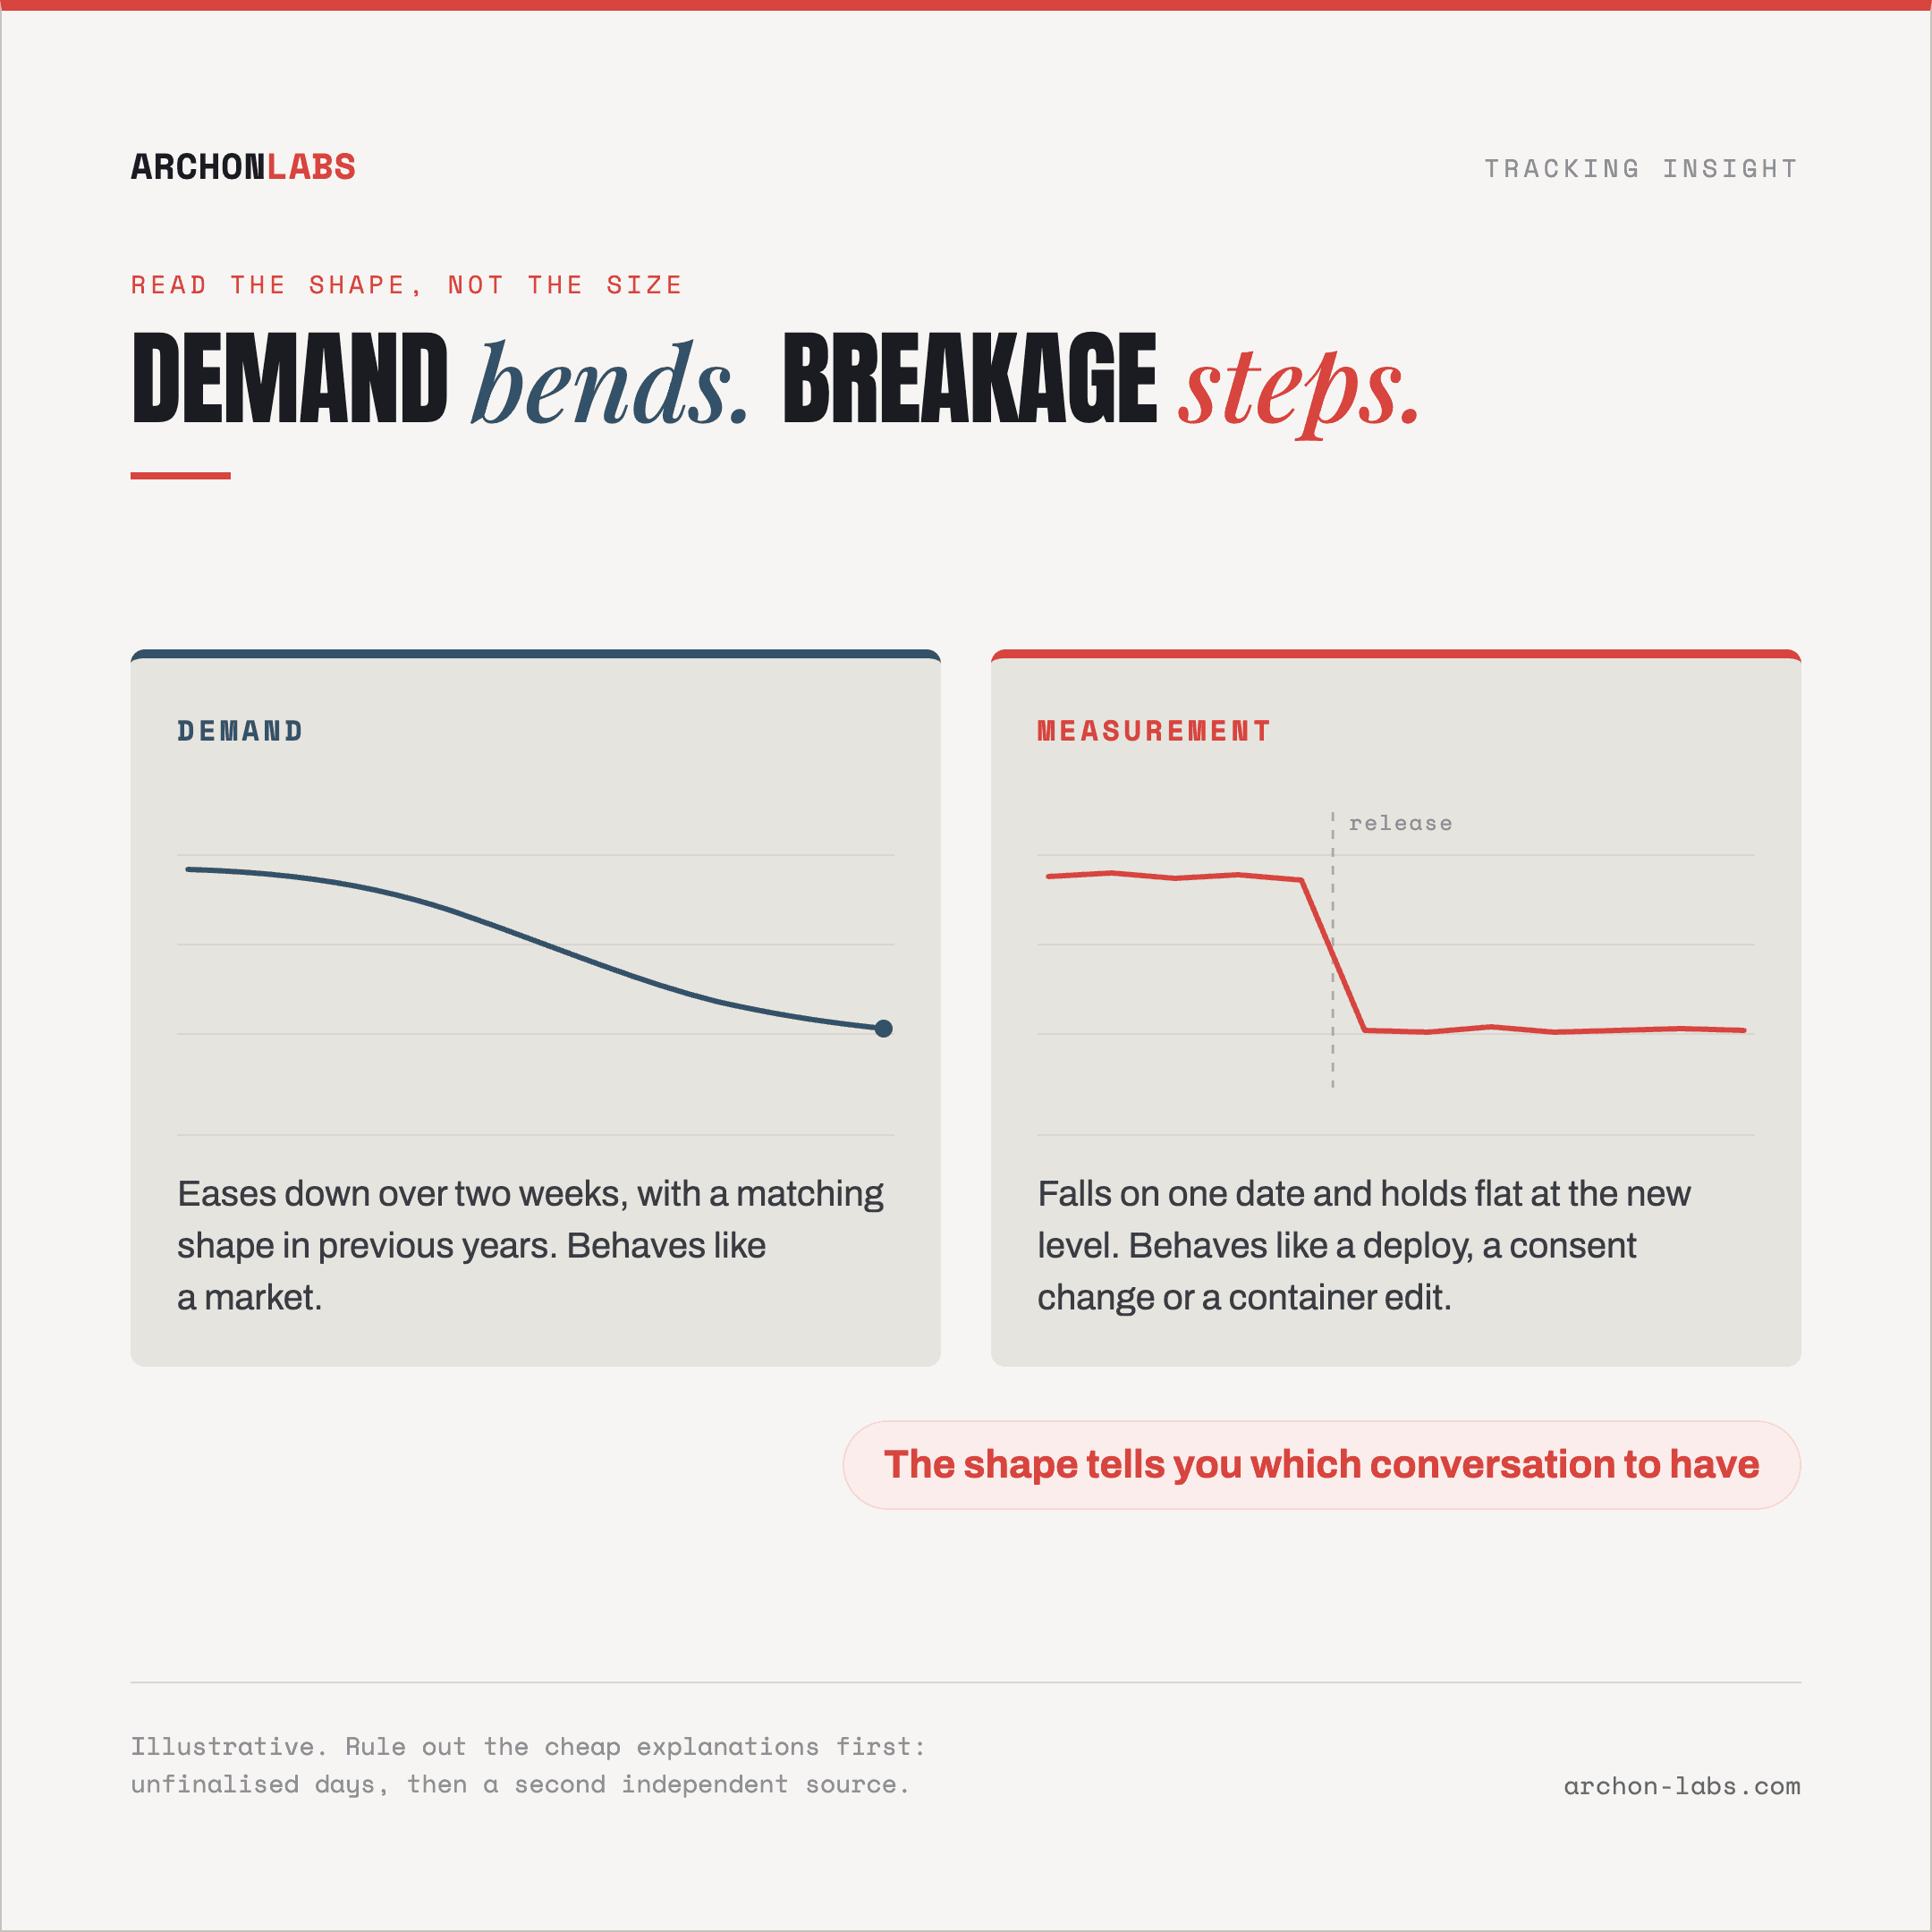
Read the shape, not the size. Demand bends, breakage steps. A decline that eases down over two weeks, with a matching shape in previous years, behaves like a market. A line that falls on one date and holds flat at the new level behaves like a deploy.
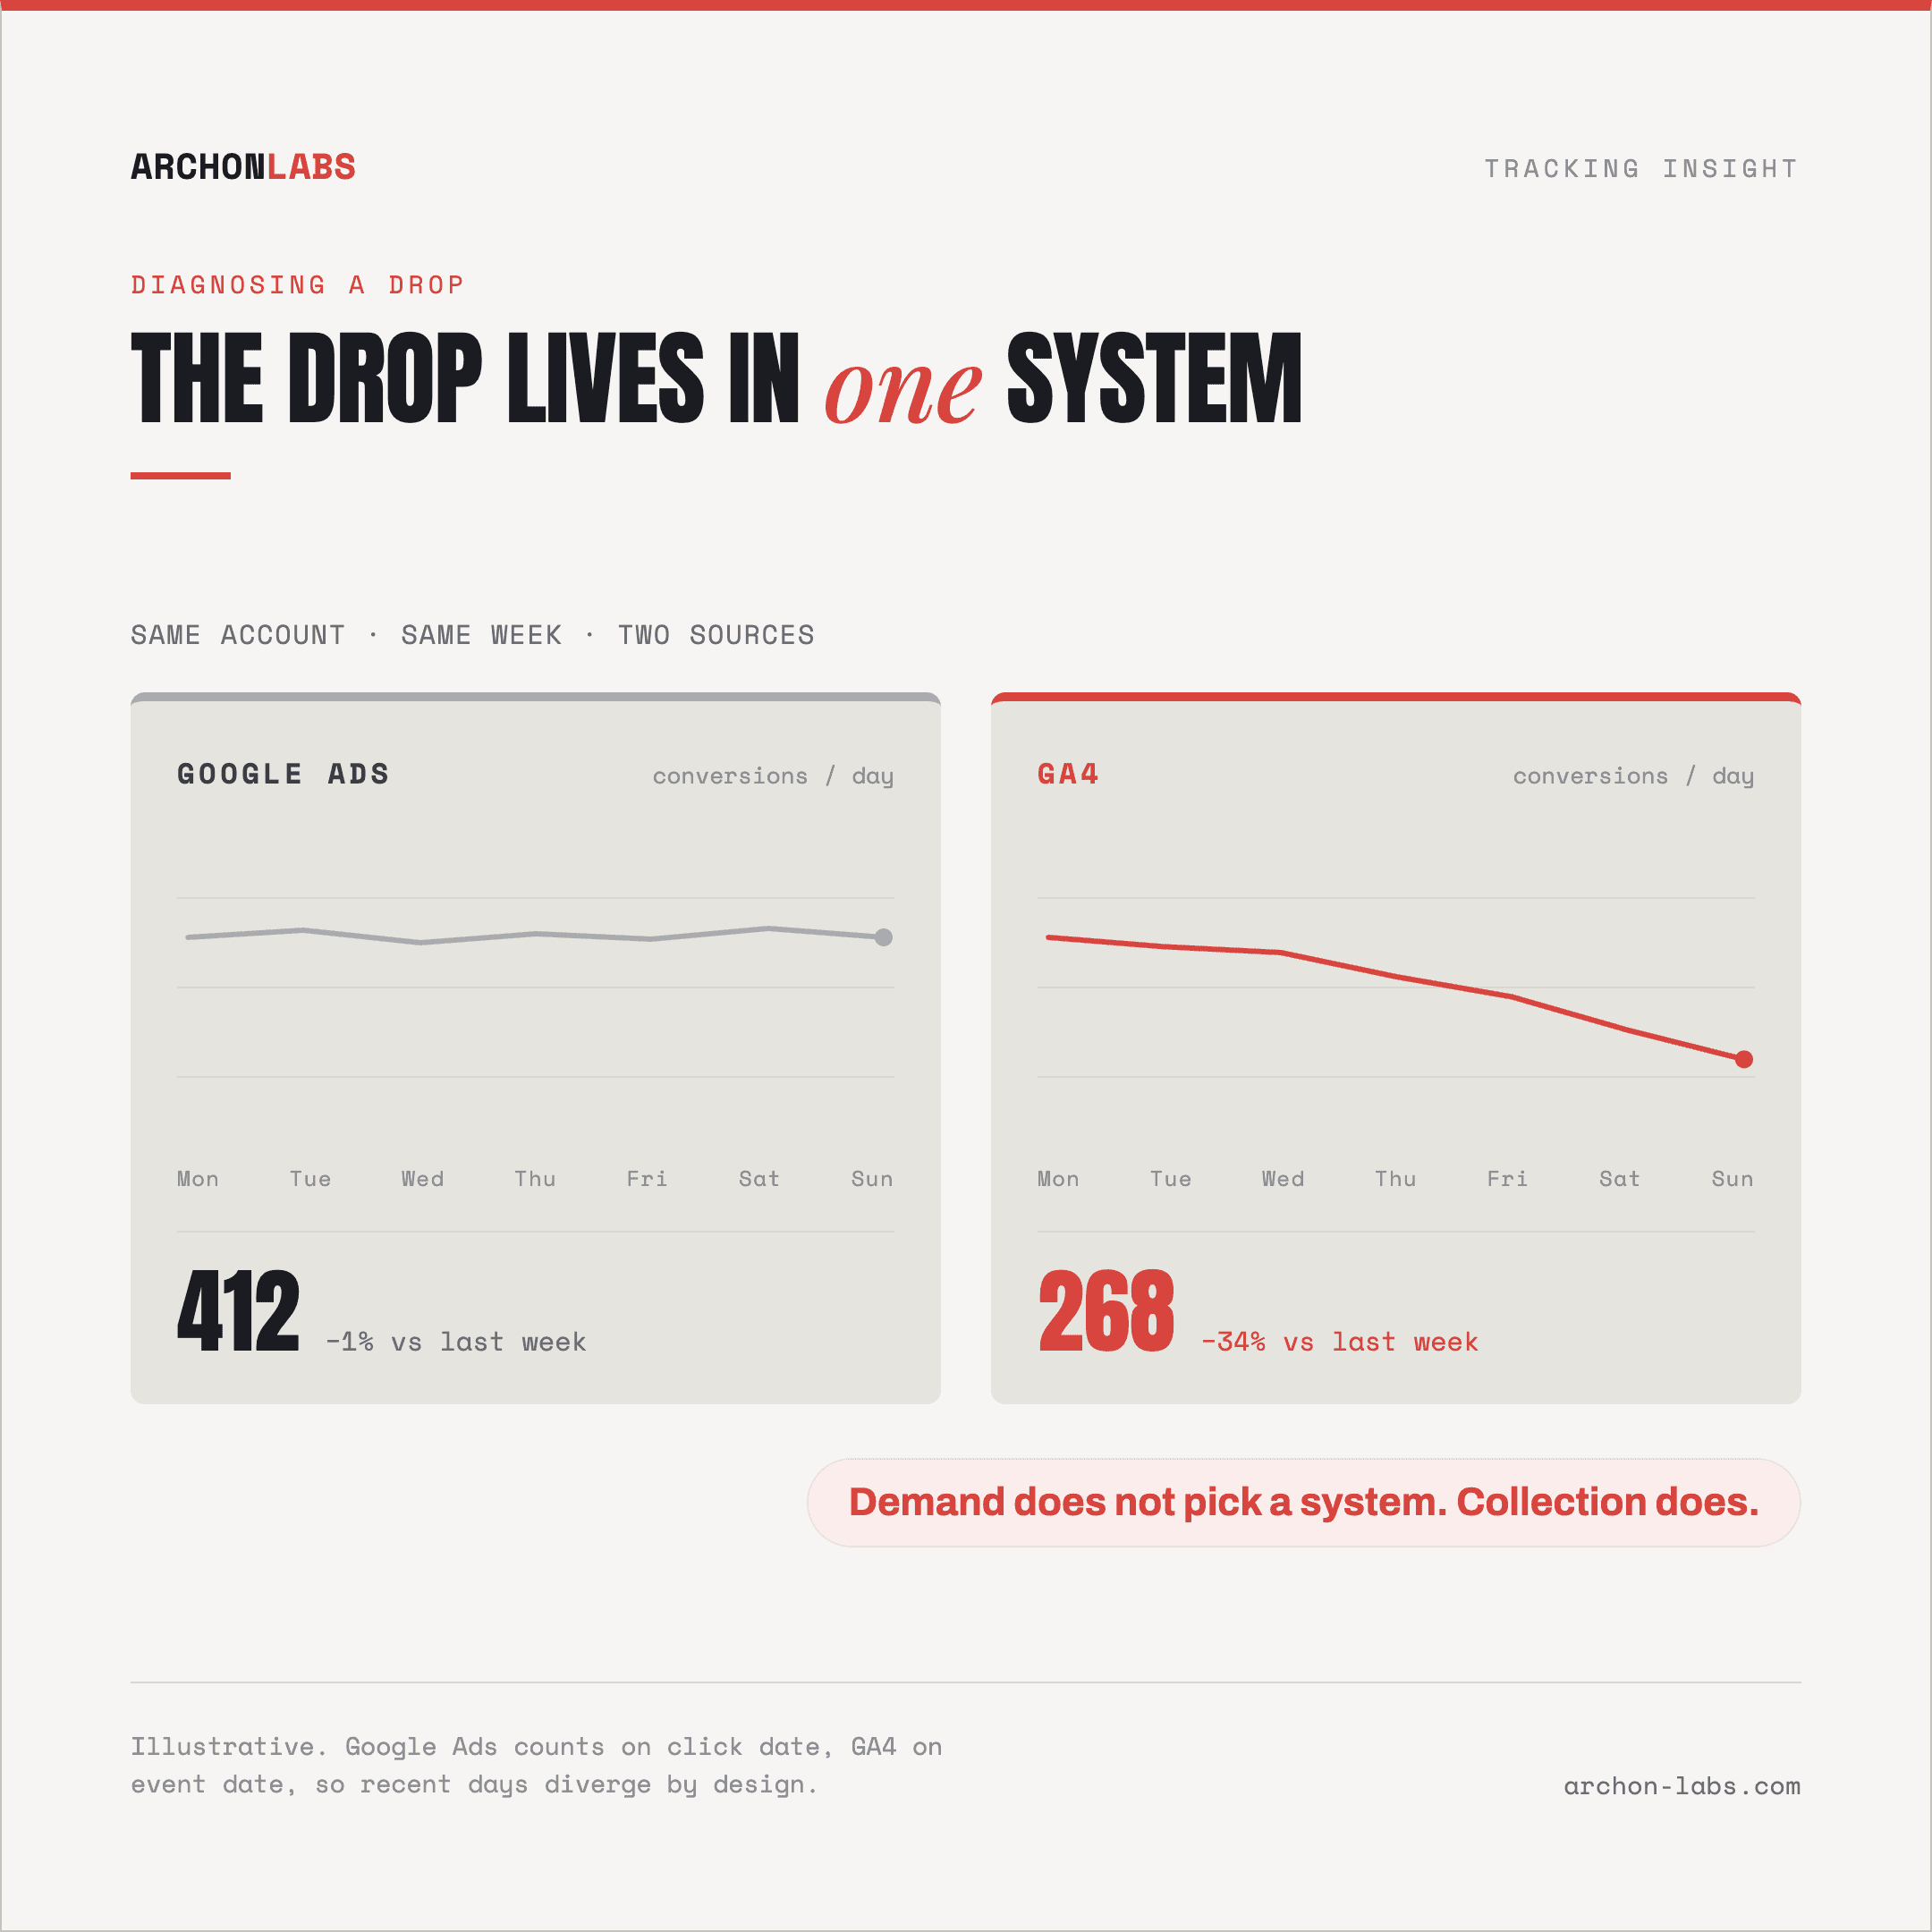
Ask a second, independent source. The most decisive test available, and nearly free. Demand does not choose a system, so a real drop in orders shows up in the ad platform, in analytics and in the backend or CRM together. A collection problem shows up in one of them.
Split the drop. Is it spread across the account, or concentrated in one browser, one device, one landing page, one conversion action? A uniform decline points at the market. A decline living inside one segment points at a technical cause with an address.
Only now look at demand data. Google Trends helps if you read it for what it is: each point is "divided by the total searches of the geography and time range it represents", then scaled from 0 to 100, so it shows relative interest, not volume. Google warns that "apparent one-off spikes should not be interpreted as real search activity", so read the trend, not the peak.
Run that sequence by hand and it costs an afternoon per incident, which is why most agencies run it only after the client asks. Archon Alert runs it continuously instead: a learned normal range per metric per client rather than one fixed threshold, a check for data that stopped arriving rather than data that got smaller, and a standing comparison of independent sources so a divergence is visible on the day it starts. It will not tell you demand moved, and no monitoring can, since consent refusals, blockers and network failure keep taking a share of events. It rules out the mechanical explanations first, so the conversation starts with you rather than with the client's screenshot. Fixing the baseline underneath helps too: a server-side setup recovers 15-40% more conversions, and fewer moving parts make a real drop easier to see. Making that signal mean something is a design question, which is why most tracking alerts fire on noise and miss real problems.
Frequently asked
How long should we wait before telling the client the drop is real?
Long enough to cover this client's conversion lag, which is measurable rather than a rule of thumb. Google Ads reports the distribution of days to conversion, and conversions can land up to 90 days after the click. If most of this client's conversions arrive within a day or two, a three-day dip is worth investigating. If half arrive after a week, the last week of data is not yet evidence of anything.
Can GA4 anomaly detection answer this for us?
Partly, and it beats a fixed threshold. Analytics Intelligence "applies a Bayesian state-space time series model to the historic data" and flags a point that falls outside the credible interval. Two limits matter. For daily anomalies the training period is 90 days, so it learns the weekday rhythm but cannot hold last December in its window, and it can only reason about data it received. A first filter, not a verdict.
Is a year over year comparison the honest test?
It is the natural test and it carries two traps. In GA4 the retention setting "only affects explorations and funnel reports", while standard aggregated reports are unaffected, so a year over year exploration on a property left at 2 months returns nothing useful while the standard report is fine. The larger trap: last year's baseline was collected under different consent behaviour, browser restrictions and modeling eligibility, so the comparison covers two measurement regimes as well as two markets.
It is only down in GA4, Google Ads looks fine. What does that mean?
It points at collection rather than demand, because a real change in orders does not pick one system. Allow first for the two platforms counting on different clocks: Google Ads places a conversion on the click date, GA4 on the event date, so they diverge in recent days by design. What is not by design is a divergence that starts on a specific date and stays, and that date usually matches a release, a consent change or a container edit.
If you cannot tell a seasonal dip from a broken tag for a client within the hour, that is a measurement problem rather than a reporting one, and a free tracking audit shows which of the two you have been looking at.