The symptom
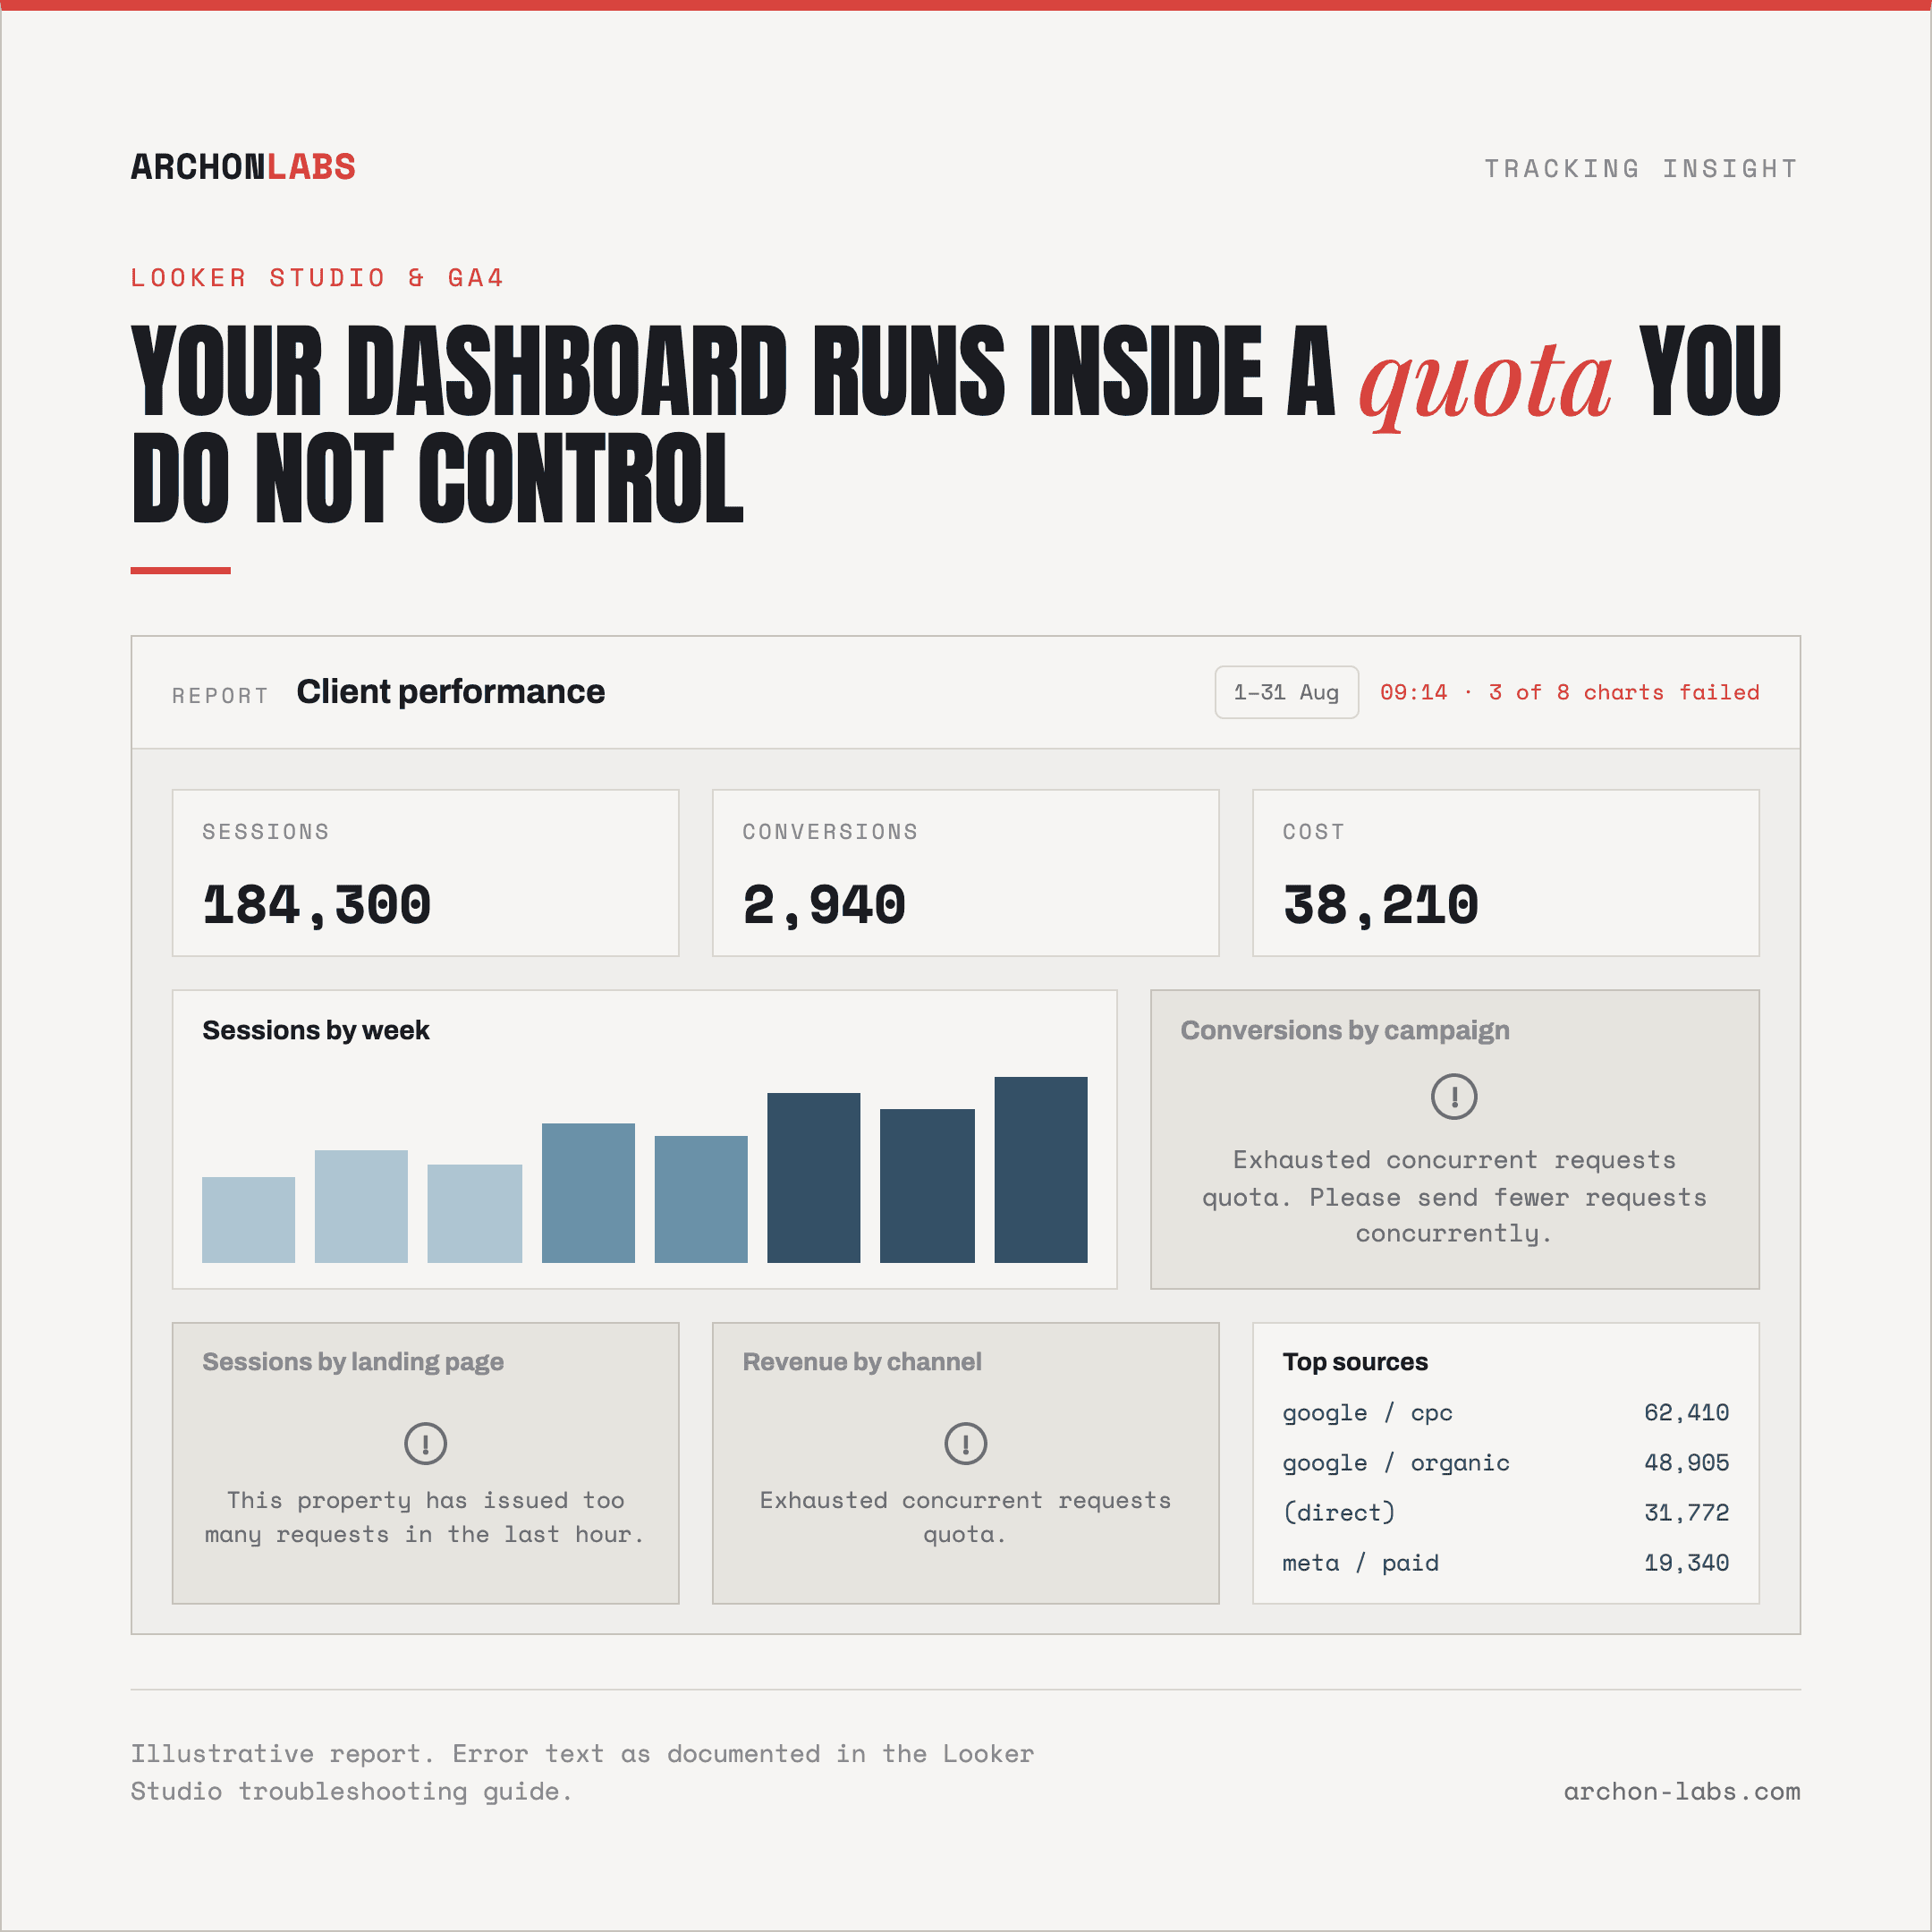
The dashboard is the deliverable the client actually opens, not the deck. So when three charts in it show a grey error box, that is what your agency gets judged on.
Somebody hits refresh, it works, the ticket dies. Two weeks later it breaks again, on the first working day of the month, when three people at the client open it inside ten minutes.
The other version is quieter and worse. The dashboard loads fine, and the conversion count does not agree with Google Ads or with last month's report. Nobody trusts a report they have to check, so the client starts pulling their own figures and your reporting becomes optional.
Why it happens
Nothing is wrong with the charts. A Looker Studio report is not a database, it is a client of whatever API you pointed it at, and each chart asks that API for its numbers when somebody opens the page. So the dashboard runs inside a rate limit that belongs to the client's Analytics property rather than to your agency, and that limit is invisible from inside the report.
Your dashboard runs inside a quota you do not control
Since 7 November 2022, reports built on GA4 data have been subject to the Analytics Data API quotas. The Looker Studio troubleshooting guide lists the errors your client is looking at, in Google's own words: "Exhausted concurrent requests quota. Please send fewer requests concurrently." and "This property has issued too many requests in the last hour."
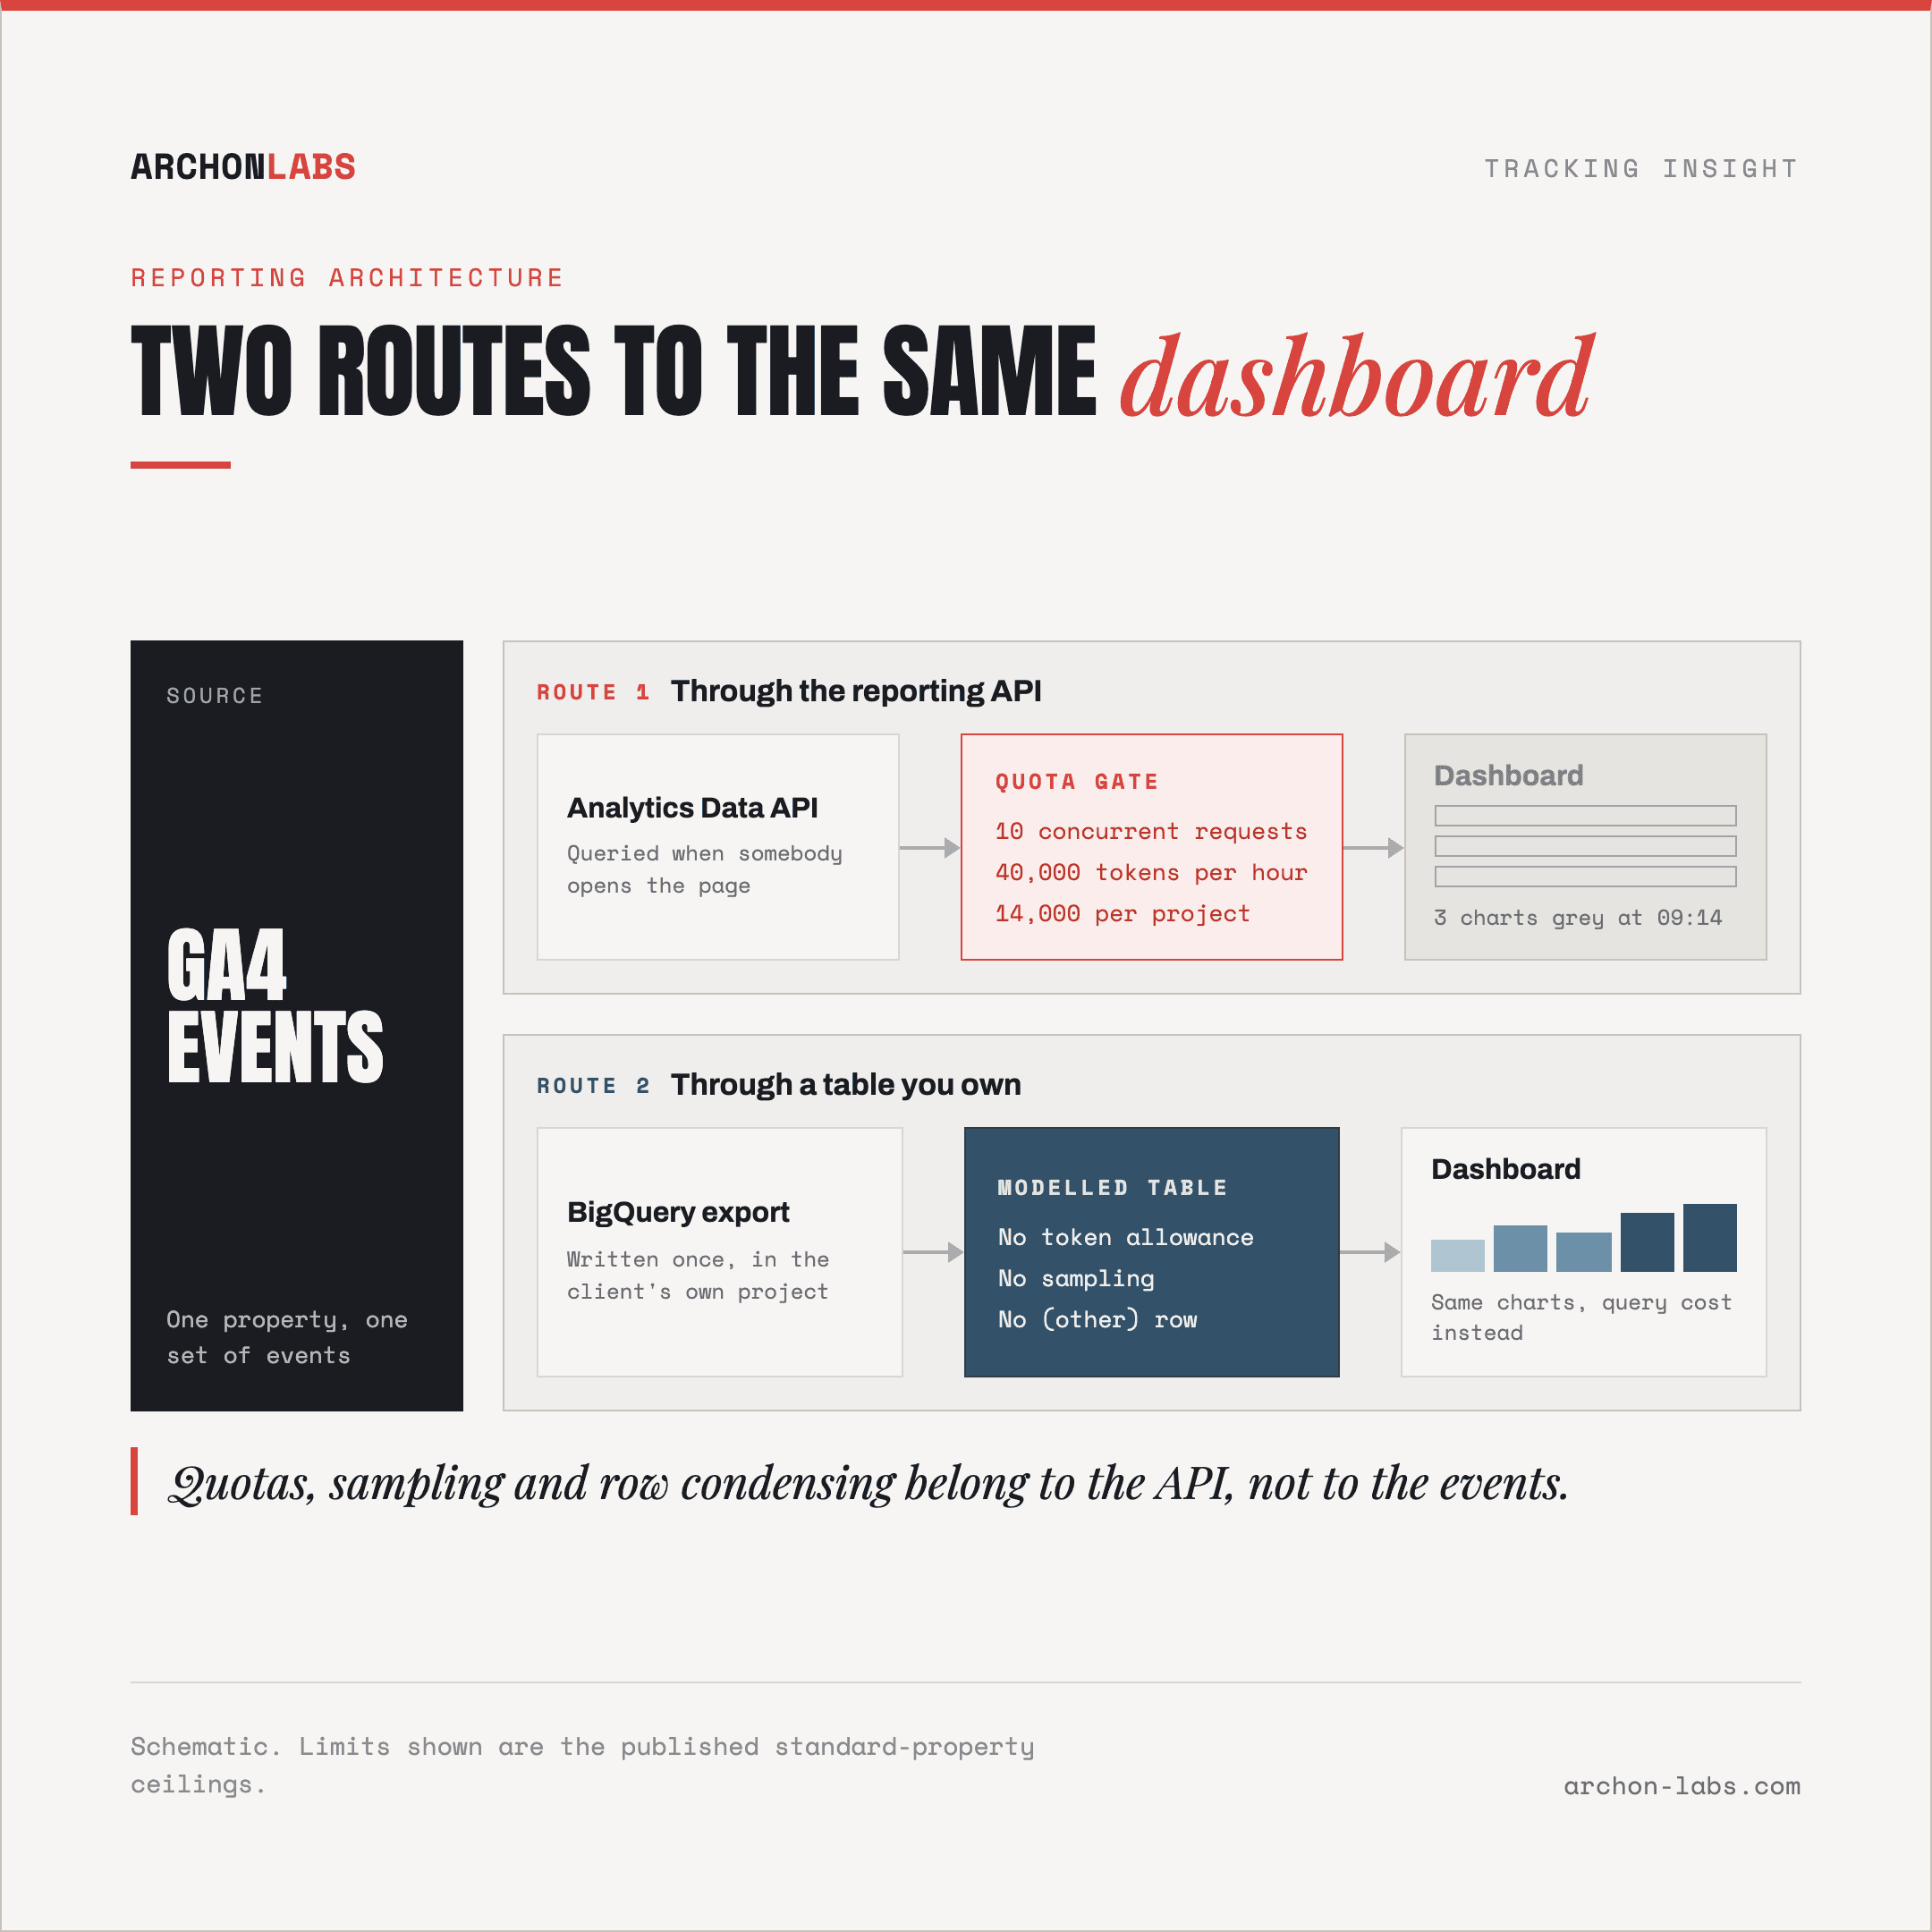
The ceilings are published. Per the Analytics Data API quota documentation, a standard property gets 200,000 core tokens per day, 40,000 per hour, and 10 concurrent requests. Analytics 360 gets ten times the tokens and 50 concurrent requests. There is also a narrower ceiling that catches agencies out: 14,000 tokens per hour per project per property, and each request counts against both that and the property total. So anything else querying the property eats from the same allowance as the client's report.
Google's own list of what pushes a report over is unglamorous: how many people open it, how many data sources it uses, how many charts sit on a page. Which is why it fails on your best accounts on the busiest morning of the month, and why nobody can reproduce it that afternoon.
Caching hides it until somebody changes a date range
The reason it works when you refresh is caching. Looker Studio serves stored results while they still count as fresh. Per the data freshness documentation, the default for Google Analytics is 12 hours with 1 and 4 hour options, Google Ads is fixed at 12 hours, and BigQuery defaults to 12 hours but can go as low as 1 minute. When that window expires, or somebody asks a question the cache has never been asked, data is fetched from the underlying dataset.
That second half is the trap. Changing the date picker or applying a filter is a new query, not a cache hit, so a report that is stable for your team is expensive for eight stakeholders who each look at their own slice. The same guide adds that a source on viewer's credentials shares cached results less often than one on the owner's.
Numbers that disagree are a different failure
Quota errors are loud. The mismatch is not, and its causes sit in the reporting layer, not in the data.
Sampling is the first. Per Analytics Help, sampling happens when the events needed for a report or request exceed the property quota, which is 10 million events per query on a standard property against up to 1 billion on 360. GA4 marks it in the data quality icon, and a dashboard built on a sampled request inherits that estimate without saying so. What that does to a client report is the subject of what GA4 sampling hides from your client reports.
Cardinality is the second. Google treats any dimension with more than 500 values as high cardinality, and when a table exceeds its row limits the less common values are condensed into an (other) row. Landing paths, product IDs and campaign names all pass 500 values on a mid-sized account, so the long tail is a bucket rather than a list.
Freshness is the third. Two charts fed by sources with different freshness windows describe two different moments. Neither is wrong, they are not talking about the same afternoon.
What good looks like
The fix is not a better dashboard, it is a different data source underneath it. Point the report at a table you own rather than at a reporting API, and those three mechanisms stop applying, because quotas, sampling and row condensing belong to the API rather than to the events. A table has no daily token allowance and no per-query event ceiling.
Be straight about the cost, because the warehouse route has documented limits of its own.
Queries cost money. Google states that the usual BigQuery query costs apply whenever Looker Studio queries the project, including manual and scheduled refreshes. How the table is built decides both speed and cost, so a badly built dashboard turns a rate limit into a bill.
The export has a ceiling on standard properties. Per Analytics Help, the daily export is capped at 1 million events, a property that consistently exceeds it has that export paused, and previous days are not reprocessed. Streaming export carries no event limit.
There is no backfill. Exported data cannot be re-exported, so the dataset starts the day somebody switches it on. Cheap this quarter, expensive to postpone.
It does not fix collection. A warehouse stores what reached it. Events lost to consent refusals, blockers and network failure are still missing, only now consistently.
Building that foundation is what Archon Pixel does: first-party collection into a BigQuery dataset in the client's own project, from the client's own domain, so cookie lifetime runs to 400 days instead of 1-7 days and around 25% more is captured than with a standard GA4 setup. Dashboards then read a modelled table instead of a live API. That is where most of the 14 hours saved per project in our performance agency case went, hours previously spent on chart archaeology and reconciling figures before client calls.
What it does not do is make the numbers whole. On a standard setup 15-30% of conversions go uncaptured, and roughly 95% of events is a realistic ceiling rather than a promise. A dashboard that is stable on a known baseline is a different thing from one that is right.
Whether an account is ready for this comes down to volume and audience, the threshold set out in when your agency has outgrown GA4. One stakeholder on a modest account is fine on the connector. Several GA4 sources and daily viewers across a client's teams are not.
FAQ
Can we not fix this with fewer charts and owner's credentials?
Partly, and it is worth doing today. Google's documented mitigations are real: put the data source on the owner's credentials, consolidate several GA4 sources into one reusable source, cut charts per page, be deliberate about who the report goes to. What they buy is headroom under a fixed ceiling. If the account grows or the client adds viewers, you spend that headroom again in a few months.
Does upgrading to Analytics 360 solve it?
For quota, yes, the published limits are ten times higher and concurrency goes from 10 to 50 requests. For sampling, largely, since the per-query ceiling rises from 10 million events to as much as 1 billion. It is also an enterprise contract, so for most clients it is a bigger decision than the reporting problem that triggered it.
What about a partner connector, does that get around the quota?
It depends what the connector does. Google lists partner connectors as a legitimate option, and some pull data on a schedule into their own storage instead of querying at render time, which changes who consumes the quota and when. Others sit on the same API and move the problem. Ask a vendor where the data lives when a chart renders, and who owns that copy.
Will the numbers change when we move a dashboard onto BigQuery?
Expect them to, and say so beforehand rather than after. Sampling and row condensing no longer apply, and conversions get counted by definitions you write rather than by an interface's defaults. The new figure is usually more defensible, but a number that moves without warning costs more trust than the old dashboard did.
If a client dashboard breaks or disagrees more often than it should, a free tracking audit traces each chart back to what is really feeding it.