The symptom
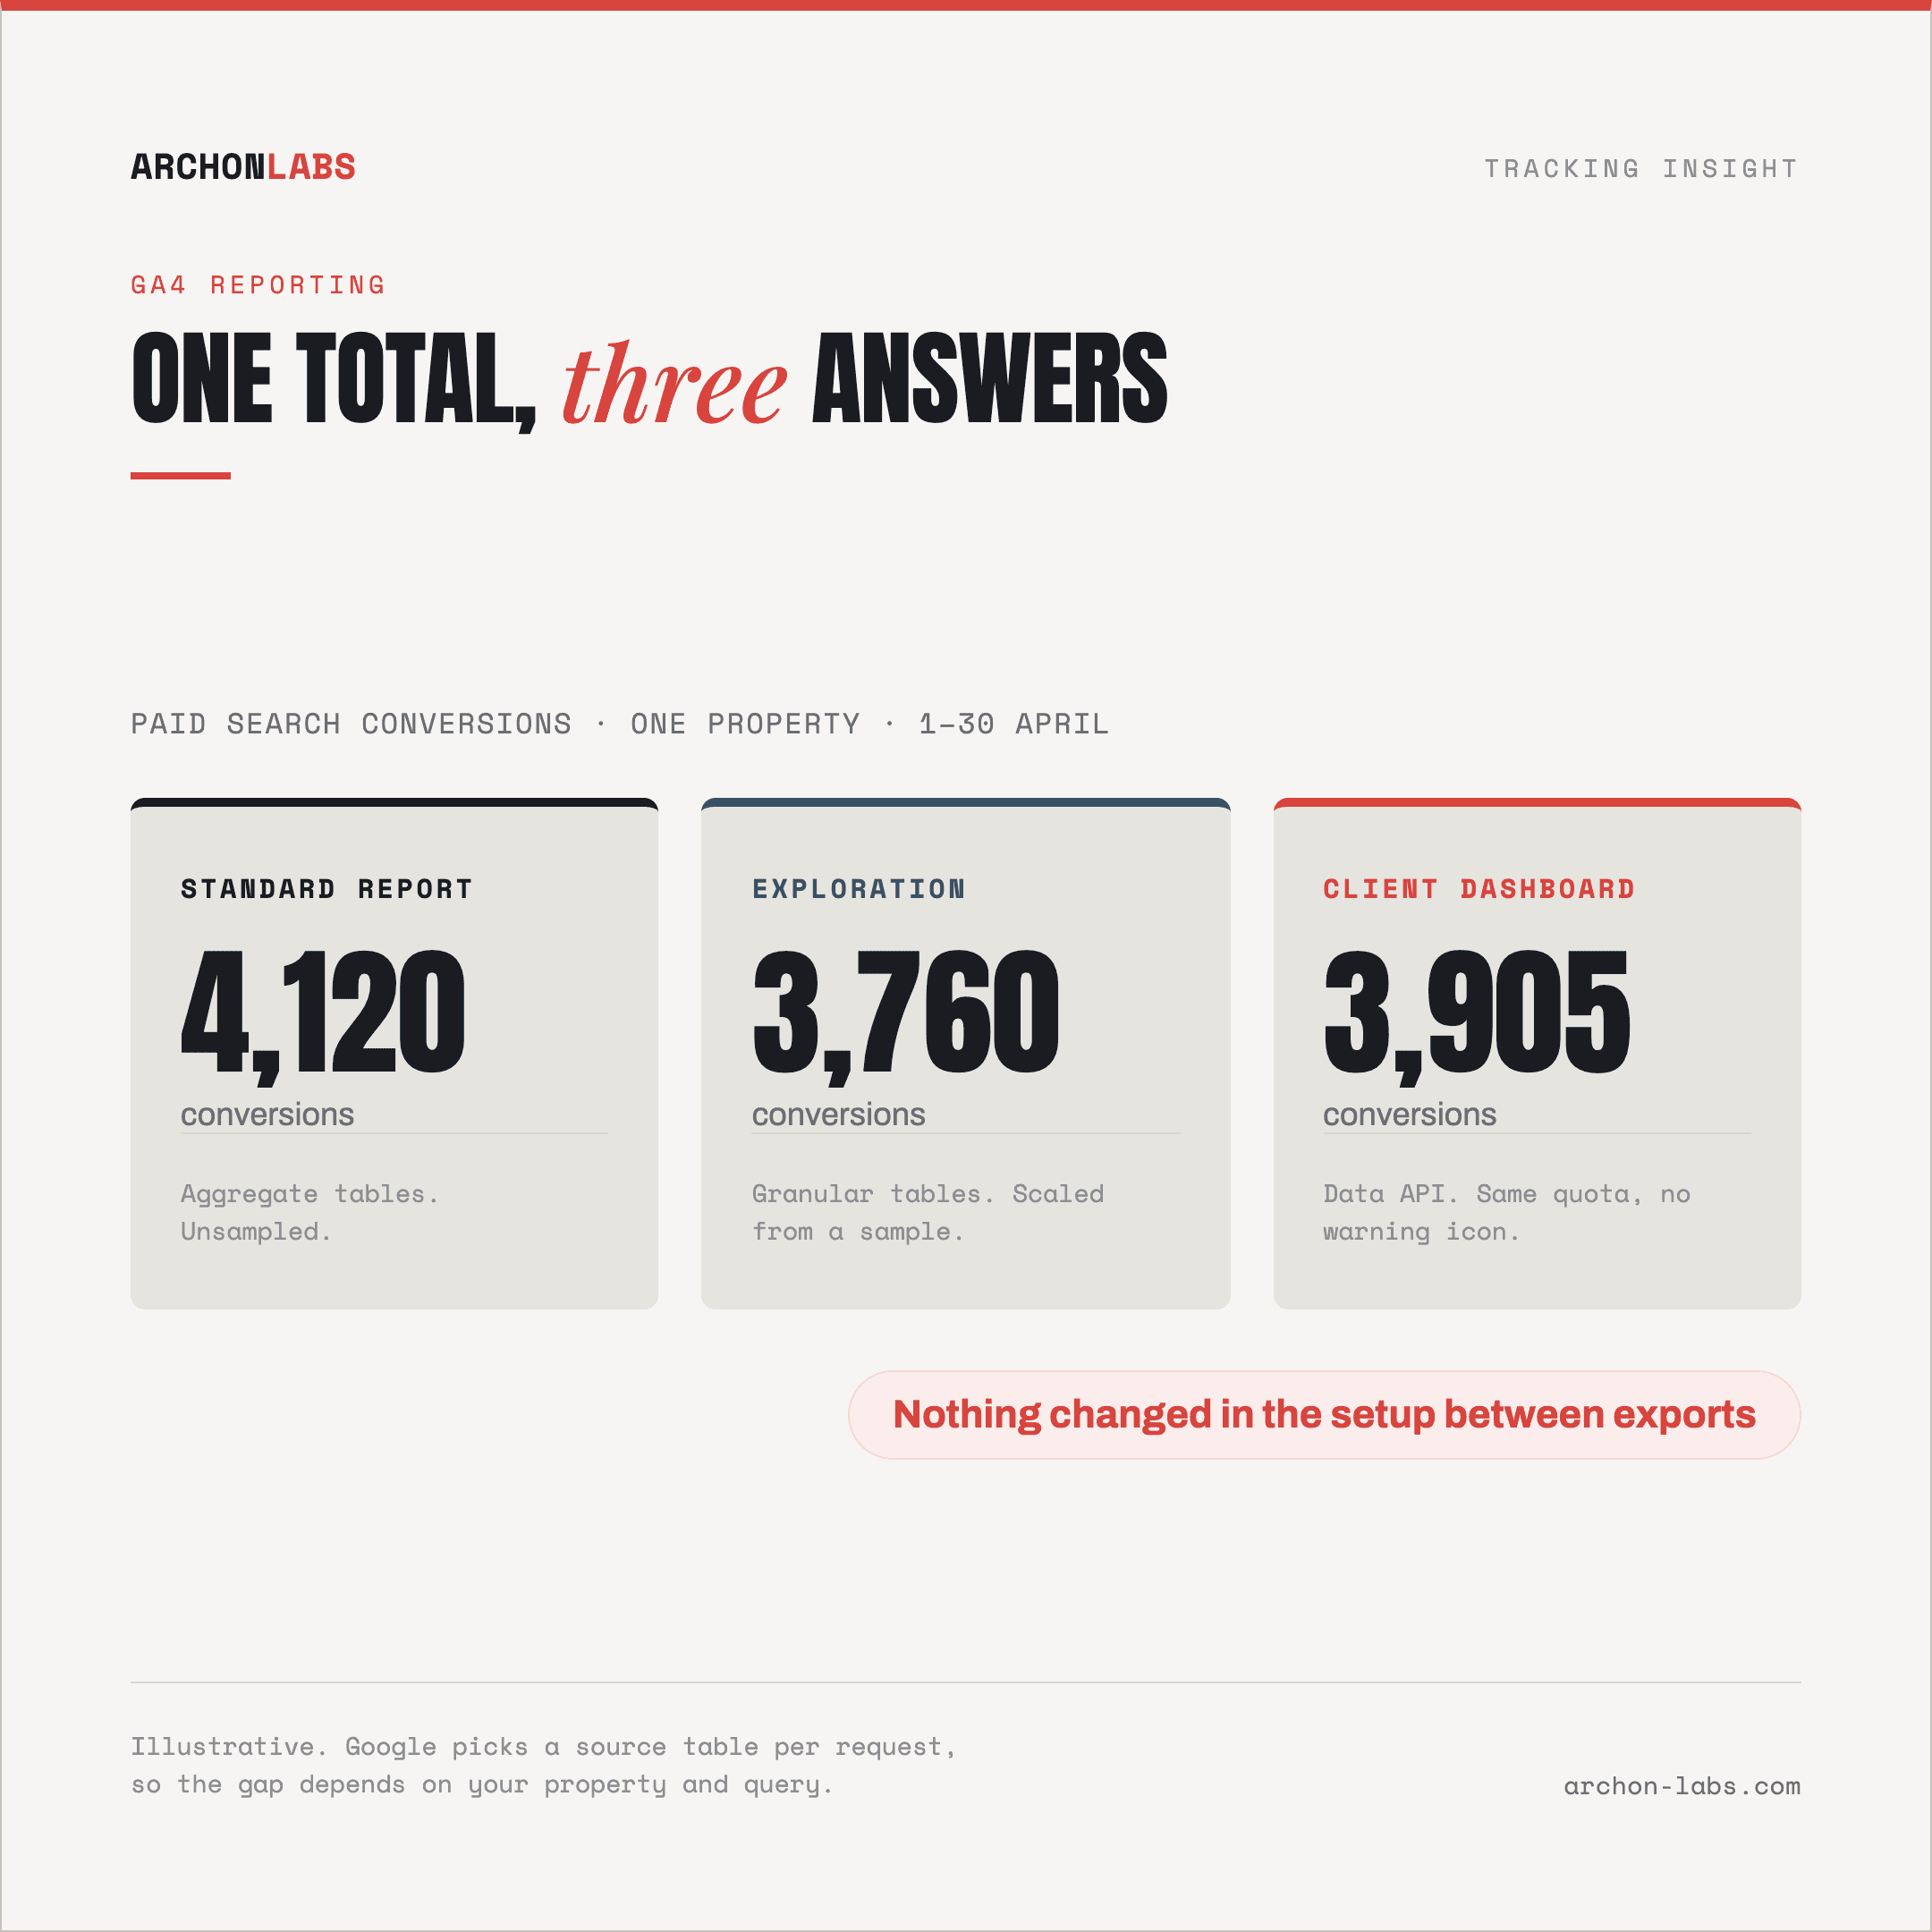
You pull the same conversion total twice and get two answers. The standard report says one thing, the exploration you built for the quarterly review says another, and the dashboard the client reads says a third. Nothing changed in the setup between the exports.
Then the date range moves. A quarterly view of your biggest account shows fewer paid search conversions than the three monthly views added together, and the client notices before you do, in the meeting.
Meanwhile the landing page report has a row called (other) above half the pages you wanted to discuss, and three small campaigns have vanished. The instinct is to blame sampling for all of it. Sampling explains part of it, the rest needs a different answer, and the wrong answer costs more credibility than the changed number did.
Why do GA4 numbers change between reports?
Because GA4 does not store your data once. Google's documentation on how Analytics stores and displays data describes two groups of tables: one that aggregates your data to answer the most common requests fast and unsampled, and one that keeps granular event and user level data for one-off investigation. For each request, across reports, explorations and the Data API, Google picks the table that gives the most accurate result within your sampling settings.
So the honest answer to "is GA4 sampled" is that it depends on the request, and what it depends on is whether the aggregate tables can answer it. Four mechanisms decide what you end up looking at, and they leave different fingerprints.
Sampling estimates a total
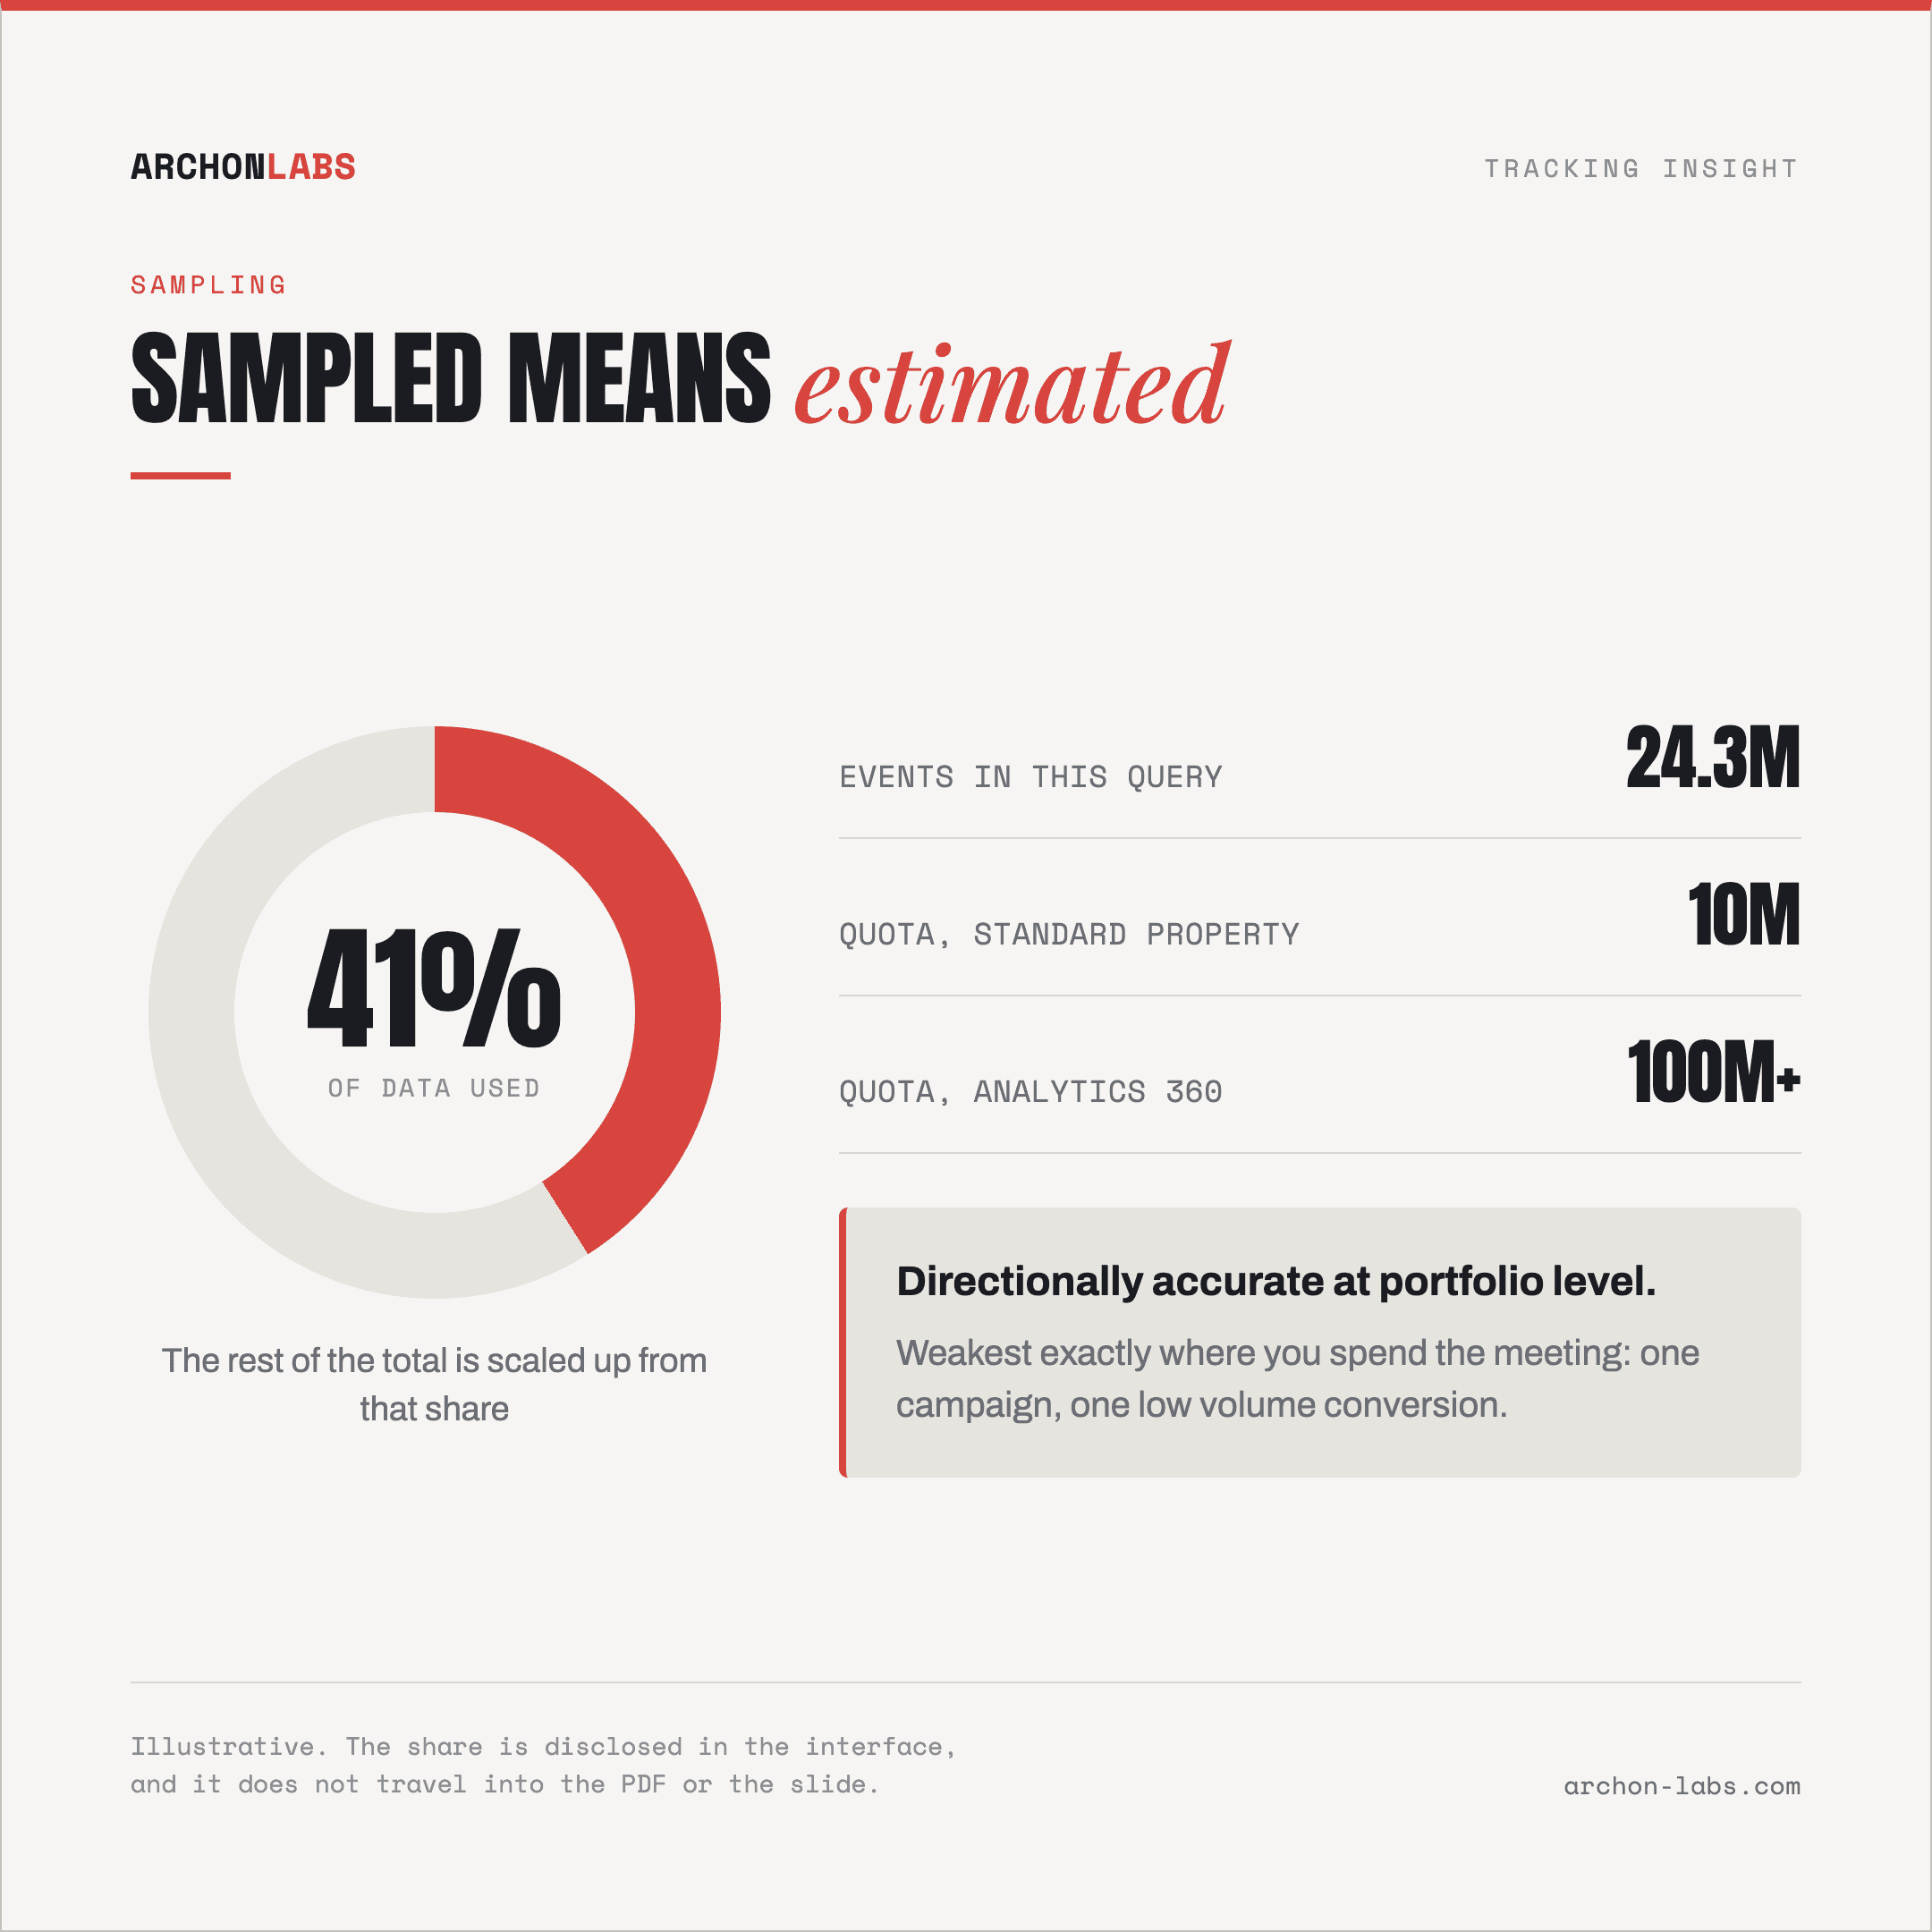
When a query reaches the granular tables and covers more events than your property's quota, Analytics analyses a portion of the data and scales it up to produce what Google's data sampling documentation calls directionally accurate results. The quota is 10 million events for a standard property. Analytics 360 starts at 100 million events per query and can go up to 1 billion, so 360 raises this ceiling without changing what your site manages to collect.
Explorations are where it bites most often, but a standard report is not immune, and Google's own page notes that filtering a large dataset by country can trigger sampling in standard reports too. Sampling is disclosed: the data quality icon tells you the share of data used, though it does not travel into the PDF or the slide.
Directionally accurate is the phrase to sit with: a scaled up estimate holds at portfolio level and is weakest exactly where you spend the meeting, on one campaign or one low volume conversion.
The (other) row removes your breakdown, not your total
An (other) row is a different mechanism with a similar symptom. Per Google's explanation of the (other) row, it appears when a table has more rows than its row limit, so Analytics keeps the most common dimension values and condenses the rest into one line. Google treats any dimension with more than 500 values as high cardinality, which covers most landing page reports and most campaign naming schemes on an account of any size.
The tell is that the total stays right while the breakdown goes soft. It is a limit on rows, not events, so it responds to how many distinct values your dimension has, not to how large your query is, and Google publishes no universal row limit, only that limits vary by property type and report.
Thresholding withholds rows on purpose
Rows also disappear for privacy reasons. Google's data thresholds documentation states that thresholds exist to prevent anyone viewing a report from inferring the identity or sensitive information of individual users, and that data may be withheld when a report includes demographic data or audiences defined with it, or when user counts inside a narrow date range are low.
That is why the missing campaigns are always the small ones, and why a demographic breakdown for a niche B2B client can be unusable while the same report on a consumer account looks healthy.
Retention shortens the history
The one that catches people out is retention. Google's data retention settings offer standard properties 2 or 14 months of event level data, while Analytics 360 reaches 26, 38 or 50 months. Retention does not affect standard aggregated reports, it applies to explorations and funnels. So a year on year exploration on a standard property is not showing you a smaller number, it is showing you a shorter history.
Where the client actually looks
Looker Studio reports built on the Google Analytics connector are subject to Google Analytics Data API quotas, and Google's comparison of reporting surfaces lists the Data API alongside reports and explorations as subject to both sampling and (other) rows, with BigQuery as the one surface subject to neither. The dashboard with the least visible warning is the one that goes out with your logo on it.
What none of this explains
Every mechanism above happens after the event reaches Google. The larger distortion happens before it. On a standard browser side setup, 15-30% of conversions are consistently uncaptured, and ad blockers strip 30-40% of events before they are ever sent. A report can be unsampled, unthresholded and free of (other) rows and still be wrong by a wider margin, because the events were never there to sample, which is the side of it we wrote up in why conversions never reach GA4.
So there is an order of operations. Sampling is a reporting problem, collection is a data problem, and fixing the reporting layer first buys you a precise view of an incomplete dataset.
What good looks like
Two changes, in this order. Fix collection, so what arrives in the property resembles what happened on the site. Then keep a raw copy of those events where the reporting tool cannot reshape them, so a number you hand a client can be recomputed, not defended from memory.
That second part is what a warehouse is for, and it is the route Google itself points to: the BigQuery export carries raw, unsampled event data, with no (other) rows and no thresholding. Archon Pixel is the productised version of both halves, a first-party measurement layer that captures 25% more than a standard GA4 setup and lands the raw events in a warehouse your client owns, with GA4 kept for the interface people already know.
Two caveats a specialist will know anyway. The free export is capped at 1 million events per day on a standard property, where 360 reaches 20 billion. And it excludes Google signals data and GA4's modelling, so a warehouse figure will not line up to the row with the interface, which is worth explaining once rather than papering over. No setup collects everything either: consent refusals, blockers and network failure always remove a share, so roughly 95% of events is a ceiling, not a promise.
Frequently asked
Are GA4 standard reports sampled or not?
Usually not. They are normally served from the aggregate tables, which return unsampled results. But Google chooses a table per request, so a filter, a comparison or an unusual dimension combination can push the same report onto the granular tables, where the quota applies. The data quality icon is the only reliable way to know which you got.
Does shortening the date range fix it?
For sampling, often yes, because fewer events per query is what the quota measures. For the other three, no. A shorter range does not lift a table's row limit, and it makes thresholding more likely rather than less, because thresholding responds to low user counts in narrow windows.
If BigQuery is unsampled, why do its numbers still differ from GA4?
Because the export is raw. Google does not export Google signals data to BigQuery, and it leaves out the modelling GA4 layers on top of observed events, so conversions GA4 models after a consent refusal are not in your tables. That is a difference in definition rather than an error in either place, the same distinction we cover in what your cookie banner really costs you in data.
What do we tell the client when a number changes?
Name the mechanism and say which category it falls into. "This total is an estimate because the query exceeded the sampling quota, the underlying events are there" is a very different message from "these conversions were never measured". Clients handle the first one fine. What damages trust is a confident number one month and a different one the next, with nothing said in between.
If you are not sure which of these is bending a client's reports, request a free tracking audit and we will tell you which of your numbers are estimates, which are incomplete, and which you can defend.